Making Decisions with Graphite
The DevOps mentality of “measure everything” can be really helpful in key moments when you need to make decisions. In particular, deploying two things side by side for the purposes of measurement can yield super helpful decision making information. For example, the Behance team was wanted to see how APC stacked up against Zend Opcode Cache.
Behance has been running APC for several years, and we’ve been pretty happy with it. There’s the typical pain, usually in unexplainable segfaults, that comes with upgrades. However, with the most recent upgrade to PHP 5.4, the segfaults got a bit out of hand. After some investigation, it turned out that APC was on it’s way out, and we should probably consider other opcode caches. However, as a rightly skeptical team, we wanted to thoroughly vet any alternative thoroughly. APC has been good to us, from a performance standpoint, and we needed to make sure that anything we changed to was as good or better.
For a baseline, we were already measuring performance using mod_log_firstbyte and kicking its output to statsd with a Graphite frontend. Once we confirmed that Zend actually worked with our app (not in production), we reconfigured one of our production web heads to use it. Luckily, our segfaults stopped, which was a fantastic sign. However, to satisfy our performance requirement, we needed some hard numbers.
Graphite has a really great API that allows you to slice and dice your data in really helpful ways. Since we were interested in comparing two data series (the newly configured server, and any older server), we were able to use the diffSeries function to graph the comparison between the two datasets, like so, and produced a graph like below.
diffSeries(stats.timers.stat_thats_likely_to_be_higher, stats.timers.stat_thats_likely_to_be_lower)
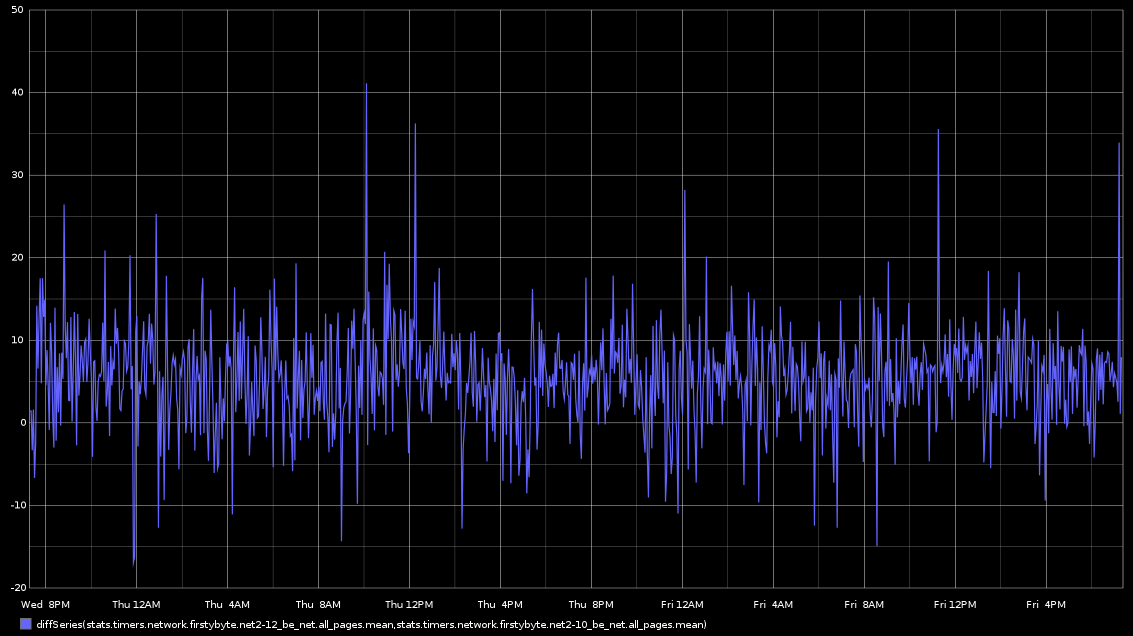
Since there’s some math involved, this isn’t the most straightforward graph to read. There are 3 patterns that emerge from using this function;
- If both series are equal, then it will produce a graph that hovers around 0.
- If the second series is consistently lower, then the graph will be consistently > 0.
- If the first series is consistently lower, then the graph will be consistently < 0.
In the case of our example, we saw a graph that was consistently above 0. This meant that Zend Opcode cache was consistently faster, to the tune of 5-10ms. Knowing that we had solved the segfaults problem, and knowing that Zend was statistically faster, the choice was super simple.